Hang Gliding Graphs
Hours By Year
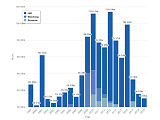
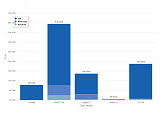
A graph showing total flight hours for each year flown. Most pilots may quote how many hours they've flown in a year; this graph is a useful indicator for which years have been the best!
Hours per Day of Week
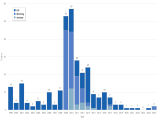
A graph showing total flight hours per day of week. This graph is useful when determining which days have historically been proved to be the most popular for flying. If the pilot is a weekend flyer, Saturdays and Sundays will appear to have the most hours flown!
Hours per Glider Model
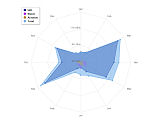
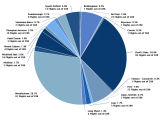
Graph showing the total number of hours flown on a glider model for each flight discipline.
Flight Hours From Sites
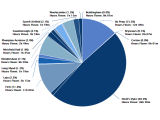
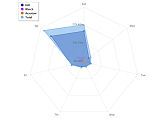
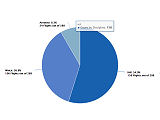
A graph showing the total number of flights hours gained from each respective launch site.

