Experiment 1: Trace Scroller
Sections in this Article:
Scrolling Using Translate
In this example a live trace is rendered by adding points just off screen then scrolling them into view by applying an svg translate transform on a timer tick. For each tick of the timer, the entire graph is moved 1 unit to the left. When points are scrolled off screen, they are removed from the svg. This vastly improves the rendering performance. For more pleasing aesthetics, 'graph paper' is rendered as a background by drawing a very, very long rectangle with a ‘graph paper’ fill. The 'graph paper' fill is achieved by creating a custom pattern and selecting this as the fill for the rectangle.
Ultimately, if left long enough, the graph paper would fully scroll off to the left and eventually [not sure how many years], the translate function will reach an upper limit and either overflow or wrap around [this hasn’t been explored].
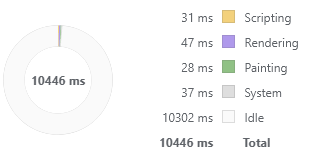
Referring to the performance monitor in Google’s Chrome, it can clearly be seen how efficient this solution is with the scripting time being minimal; a huge improvement on the previous example both in terms of scripting time and rendering and painting! This is possible as the ‘scrolling’ has been offloaded to the hardware and with any reasonable GPU; it will make short work of it!
Code
1"use strict";
2class SVGScrollerTranslate extends HTMLElement {
3
4    // reference to the shadow DOM
5    _shadow = null;
6
7    // cache references to elements
8    _graph = null;
9    _pane1 = null;
10    _pointsCh1 = null;
11    _pointsCh2 = null;
12
13    _x = 0;             // scroll position
14    _ticks = 0;         // count of timer ticks
15    _timeId = null;     // Id of the timer
16
17    constructor() {
18        super();
19    }
20
21    connectedCallback() {
22        this._shadow = this.attachShadow({mode: 'open'});
23        this.render();
24
25        this._timeId = window.setInterval( () => {
26            // how many points between each logical division
27            let divisions=10;
28
29             // this can probably be optimised without setting the attribute!
30            this._pane1.setAttribute("transform", 'translate('+(this._x/divisions)+' 0)');
31
32            // time position (x axis) - svg is 100 units wide, starting at 100 adds points to the right side which will then be scrolled into view
33            let chx = 100+(this._ticks/divisions);
34
35            // add some data - channel 1
36            let ch1y = 35+(Math.sin(this._ticks/(30))*12)+(Math.sin(this._ticks/(22*1))*9)+2+(Math.cos(this._ticks/(22*2))*7);
37            let point1 = this._graph.createSVGPoint();
38            point1.x = chx;
39            point1.y = ch1y;
40            this._pointsCh1.appendItem(point1);
41
42            // add some data - channel 2
43            let ch2y = 35+(Math.cos(this._ticks/50)* 15);
44            let point2 = this._graph.createSVGPoint();
45            point2.x = chx;
46            point2.y = ch2y;
47            this._pointsCh2.appendItem(point2);
48
49            // start removing points as soon as we have a screen width; this keeps the performance over time!
50            if(this._pointsCh1.length > (200*divisions)) this._pointsCh1.removeItem(0);
51            if(this._pointsCh2.length > (200*divisions)) this._pointsCh2.removeItem(0);
52
53            this._ticks++; // just a count of how many times the timer has fired!
54            this._x--; // scroll left; there will be an upper (or lower limit)
55
56        }, 10 ); // timer interval
57    }
58
59    render() {
60        if(!this._shadow) return; // not ready yet, don't render
61
62        let html="";
63
64        html+='<style>:host { width: 100%; display: inline-block; text-align: center; }</style>';
65        html+='<svg style="border: solid silver 1px;" width="100%" height="360px" preserveAspectRatio="none" id="graph" viewbox="0 10 100 60">';
66
67        // defs - create a grid pattern which will be used to make the axis
68        html+='';
69        html+='<defs>';
70        html+='  <pattern id="pattern1"';
71        html+='    x="10" y="10" width="20" height="20"';
72        html+='     patternUnits="userSpaceOnUse" >';
73
74        for(let i=1; i<21; i+=2) {
75            let stroke = (i==1||i==11) ? "0.05" : "0.02";
76            html+='       <line x1="'+i+'" y1="0" x2="'+i+'" y2="20" style="stroke-width: '+stroke+'; stroke: #8080ff"; />';
77            html+='       <line y1="'+i+'" x1="0" y2="'+i+'" x2="20" style="stroke-width: '+stroke+'; stroke: #8080ff"; />';
78        }
79        html+='  </pattern>';
80        html+='</defs>';
81
82        // create a graphic group, this will be translated to produce the scrolling
83        html+='  <g id="pane1" transform="translate(0 0)">';
84
85        // render a rectangle filled with the grid pattern
86        html+='    <rect x="0" y="0" width="1000000" height="100" style="stroke: none; fill: url(#pattern1);" />';
87
88        // create two polyline for each channel - these will be populated with points later
89        html+='    <polyline id="channel1" style="fill:none;stroke:blue;stroke-width:0.2;opacity:0.7;"/>';
90        html+='    <polyline id="channel2" style="fill:none;stroke:red;stroke-width:0.5;opacity:0.7;"/>';
91
92        html+='  </g">';
93        html+='</svg>';
94
95        // cache references to objecs
96        this._shadow.innerHTML = html;
97        this._graph = this._shadow.querySelector("#graph");
98        this._pane1 = this._graph.querySelector("#pane1");
99        this._pointsCh1 = this._graph.querySelector("#channel1").points;
100        this._pointsCh2 = this._graph.querySelector("#channel2").points;
101    }
102}
103
104customElements.define('svg-scroller-translate', SVGScrollerTranslate );
105
Continue on reading to Conclusions...

