Experiment 1: Trace Scroller
Sections in this Article:
Scrolling with Circular Buffers
The core of this design is to create an efficient svg scroller that could be used for 'live-charting'. One simple approach would be to render the graph entirely then translate it for scrolling, however there are limitations with this approach such as appending of new data and the removal of old. This will be explored a little later. Below is an exploration of creating circular buffers for each 'Channel'. A timer is used to create the animation by 're-drawing' the trace lines for each frame after advancing the circular buffer pointers. For performance, DOM manipulation is avoided as much as possible with only the attribute for the svg's polyline being updated.
Referring to the performance monitor in Google’s Chrome, it can clearly been that script execution is where most of the processing is; hardly surprising when considering 1000 points of data are being re-drawn at a different offset with each tick of the timer!
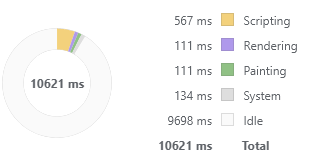
There’s clearly scope for improvement here and this will be explored in the next page.
Code
The source code for this example is presented below.
scroller.js
1"use strict";
2
3class SVGScroller extends HTMLElement {
4    _shadow = null;
5    _graph = null;
6    _pane1 = null;
7    _channel1 = null;
8    _channel2 = null;
9    _x = 500;
10
11    _points_ch1 = [];
12    _points_ch1_ptr = 0;
13    _points_ch2 = [];
14    _points_ch2_ptr = 0;
15
16    _tickCount = 0;
17
18    constructor() {
19        super();
20        let numPoints = 500;
21        let y=0;
22
23        // pre-populate the circular buffers for channels 1-2
24        for( let i=0; i<numPoints; i++ ) {
25           this._points_ch1[i] = 33.3+10*Math.sin(i/70);
26           this._points_ch2[i] = 11+10*Math.cos(i/5);
27        }
28    }
29
30    connectedCallback() {
31        this._shadow = this.attachShadow({mode: 'open'});
32        this.render();
33
34        // start the animation timer
35        window.setInterval( () => {
36            let points = "";
37            let x=0;
38            let y=0;
39            let x1=null;
40            let y1=null;
41            let numPoints;
42            let i=0;
43            let idx = 0;
44            let convx=0;
45
46            numPoints = this._points_ch1.length;
47            convx = ((numPoints-1)/100);
48
49            points="";
50            for(i=0; i<numPoints; i++) {
51                x = i/convx;
52                idx = i + this._points_ch1_ptr;
53                if(idx>=(numPoints)) idx-=(numPoints);
54                y=this._points_ch1[idx];
55                points+=x.toFixed(2)+","+y.toFixed(2)+" ";
56            }
57            this._channel1.setAttribute("points", points);
58
59            numPoints = this._points_ch2.length;
60            points="";
61            for(i=0; i<numPoints; i++) {
62                x = i/convx;
63                idx = i + this._points_ch2_ptr;
64                if(idx>=(numPoints)) idx-=(numPoints);
65                y=this._points_ch2[idx];
66                points+=x.toFixed(2)+","+y.toFixed(2)+" ";
67            }
68            this._channel2.setAttribute("points", points);
69
70            this._points_ch1[this._points_ch1_ptr] = 36+8*Math.sin(this._tickCount/40)+5*Math.cos(this._tickCount/33)-3*Math.sin(this._tickCount/76);
71            this._points_ch2[this._points_ch2_ptr] = 20+10*Math.sin(this._tickCount/60);
72
73            if(++this._points_ch1_ptr>=(numPoints)) this._points_ch1_ptr=0;
74            if(++this._points_ch2_ptr>=(numPoints)) this._points_ch2_ptr=0;
75
76            this._tickCount++;
77
78        }, 10 );
79
80    }
81
82    render() {
83        if(!this._shadow) return; // not ready yet, don't render
84
85        let html="";
86        let y=0;
87        let x = 0;
88        let points = "0,30 100,30";
89
90        html+='<style>:host { width: 100%; height: 100px; display: inline-block; text-align: center; }</style>';
91        html+='<svg id="graph" viewbox="0 0 100 60">';
92        html+='  <g id="pane1" transform="translate(0 0)">';
93        html+='    <polyline id="channel1" points="'+points+'" style="fill:none;stroke:blue;stroke-width:0.6;opacity:0.6;"/>';
94        html+='    <polyline id="channel2" points="'+points+'" style="fill:none;stroke:red;stroke-width:0.6;opacity:0.6;"/>';
95        html+='  </g">';
96        html+='</svg>';
97
98        this._shadow.innerHTML = html;
99        this._graph = this._shadow.querySelector("#graph");
100        this._pane1 = this._graph.querySelector("#pane1");
101        this._channel1 = this._graph.querySelector("#channel1");
102        this._channel2 = this._graph.querySelector("#channel2");
103    }
104}
105
106customElements.define('mfx-scroller', SVGScroller );
Walk Through
It's nothing magical or clever, here's the walk through...
- Line 3 Creates the class to for the Web Component; note that this inherits from HTMLElement.
- Lines 4-16 Initialises some member variables.
- Lines 18-28 Class constructor, initialises some variables and populates the channel data arrays with some initial data. These arrays will be used as a circular buffer.
- Line 30 Life-cycle hook for the web-component.
- Line 31 Create the shadow DOM; this is where we'll render the SVG.
- Line 35 Start off a timer to call back regularly for the animations; should really store the setInternal return function here, but as we don't need to do anything with it in this example, no need!
- Lines 36-80 This is the anonymous method passed to the setInternal function; this is where all the magic happens.
- Lines 36-44 Declaring and setting-up variables.
- Lines 46-47 Defining the mapping ratio between buffer length and width of screen (100 wide - see SVG view port on Line 91).
- Line 53 Ensuring the index into the buffer is corrected for the current circular buffer position.
- Lines 49-56 Creating all the points across the screen for channel 1, ready to be inserted into the polyline for channel 1 (see Line 93).
- Lines 57 Without changing the structure of the DOM, write the point data into the polyline representing channel 1.
- Lines 59-68 Duplicate of Lines 49-57 but for Channel 2.
- Lines 70-71 Add some new data at the end of the circular buffer for Channels 1 and 2.
- Lines 73-43 Advance the circular buffer pointers for Channels 1 and 2 and roll them around if needed.
- Line 76 Increment a general tick counter; only purpose of this is to generate new values for Channels 1 and 2.
- Lines 82-103 render method; creating the component html by creating an svg with two polylines for Channels 1 and 2.
- Line 98 Placing the html into the shadow root; this is the rendering instructions that the browser will use when rendering the Web Component.
- Lines 99-102 Caching references to components within the svg; particularly for this._channel1 and this._channel2 that are used extensively in Lines 57 and 68 respectively. This is a performance trick!
- Line 106 Registering the Web Component and handling class. This allows the Web Component to be placed within a browser using the <mfx-scroller> element tag.
Continue on reading to Scrolling Using Translate...

